Tracetest + Dynatrace: Unified Observability for Testing
.jpg)

📢 Exciting news! Tracetest has integrated with Dynatrace to offer unified observability for testing. You can create trace-based tests & monitor them over time
Table of Contents
Get started with Tracetest!
Try Managed Tracetest Today!
Today, we're happily announcing that Tracetest works with Dynatrace, the unified Observability and security platform.
### _Check out this [hands-on Demo example](https://github.com/kubeshop/tracetest/tree/main/examples/tracetest-dynatrace) of how Tracetest works with Dynatrace!_
## What is Dynatrace?
[Dynatrace](https://www.dynatrace.com/) is a unified observability and security platform that allows you to monitor and secure your full stack on one AI-powered data platform. From infrastructure and application observability to real-time security analytics and protection, digital experience monitoring and business analytics. All are underpinned by a composable app-based platform with a custom Observability-driven workflow engine.
## What is Tracetest?
[Tracetest](https://tracetest.io/) is a tool for trace-based testing. It’s [open source](https://github.com/kubeshop/tracetest) and part of the CNCF landscape.
Tracetest uses your existing [OpenTelemetry](https://opentelemetry.io/) traces to power trace-based testing with assertions against your trace data at every point of the request transaction. You only need to point Tracetest to your existing trace data source, or send traces to Tracetest directly!
Tracetest makes it possible to:
* Define tests and assertions against every single microservice that a trace goes through.
* Build tests based on your already instrumented system.
* Define multiple transaction triggers, such as a GET against an API endpoint, a GRPC request, a Kafka message queue, etc.
* Define assertions against both the response and trace data, ensuring both your response and the underlying processes worked as intended.
* Save and run the tests manually or via CI build jobs with the Tracetest CLI.
## Tracetest Now Works with Dynatrace!
[Tracetest now works with Dynatrace](https://docs.tracetest.io/configuration/connecting-to-data-stores/dynatrace), allowing you to bring the combined power of Tracetest and Dynatrace to your developer workflows. Write trace-based tests and have Tracetest augment the Dynatrace always-on regression detection capabilities.
If you already have OpenTelemetry instrumentation configured in your code and are using an OpenTelemetry Collector with Dynatrace, adding Tracetest to your infrastructure can enable you to write detailed trace-based tests.
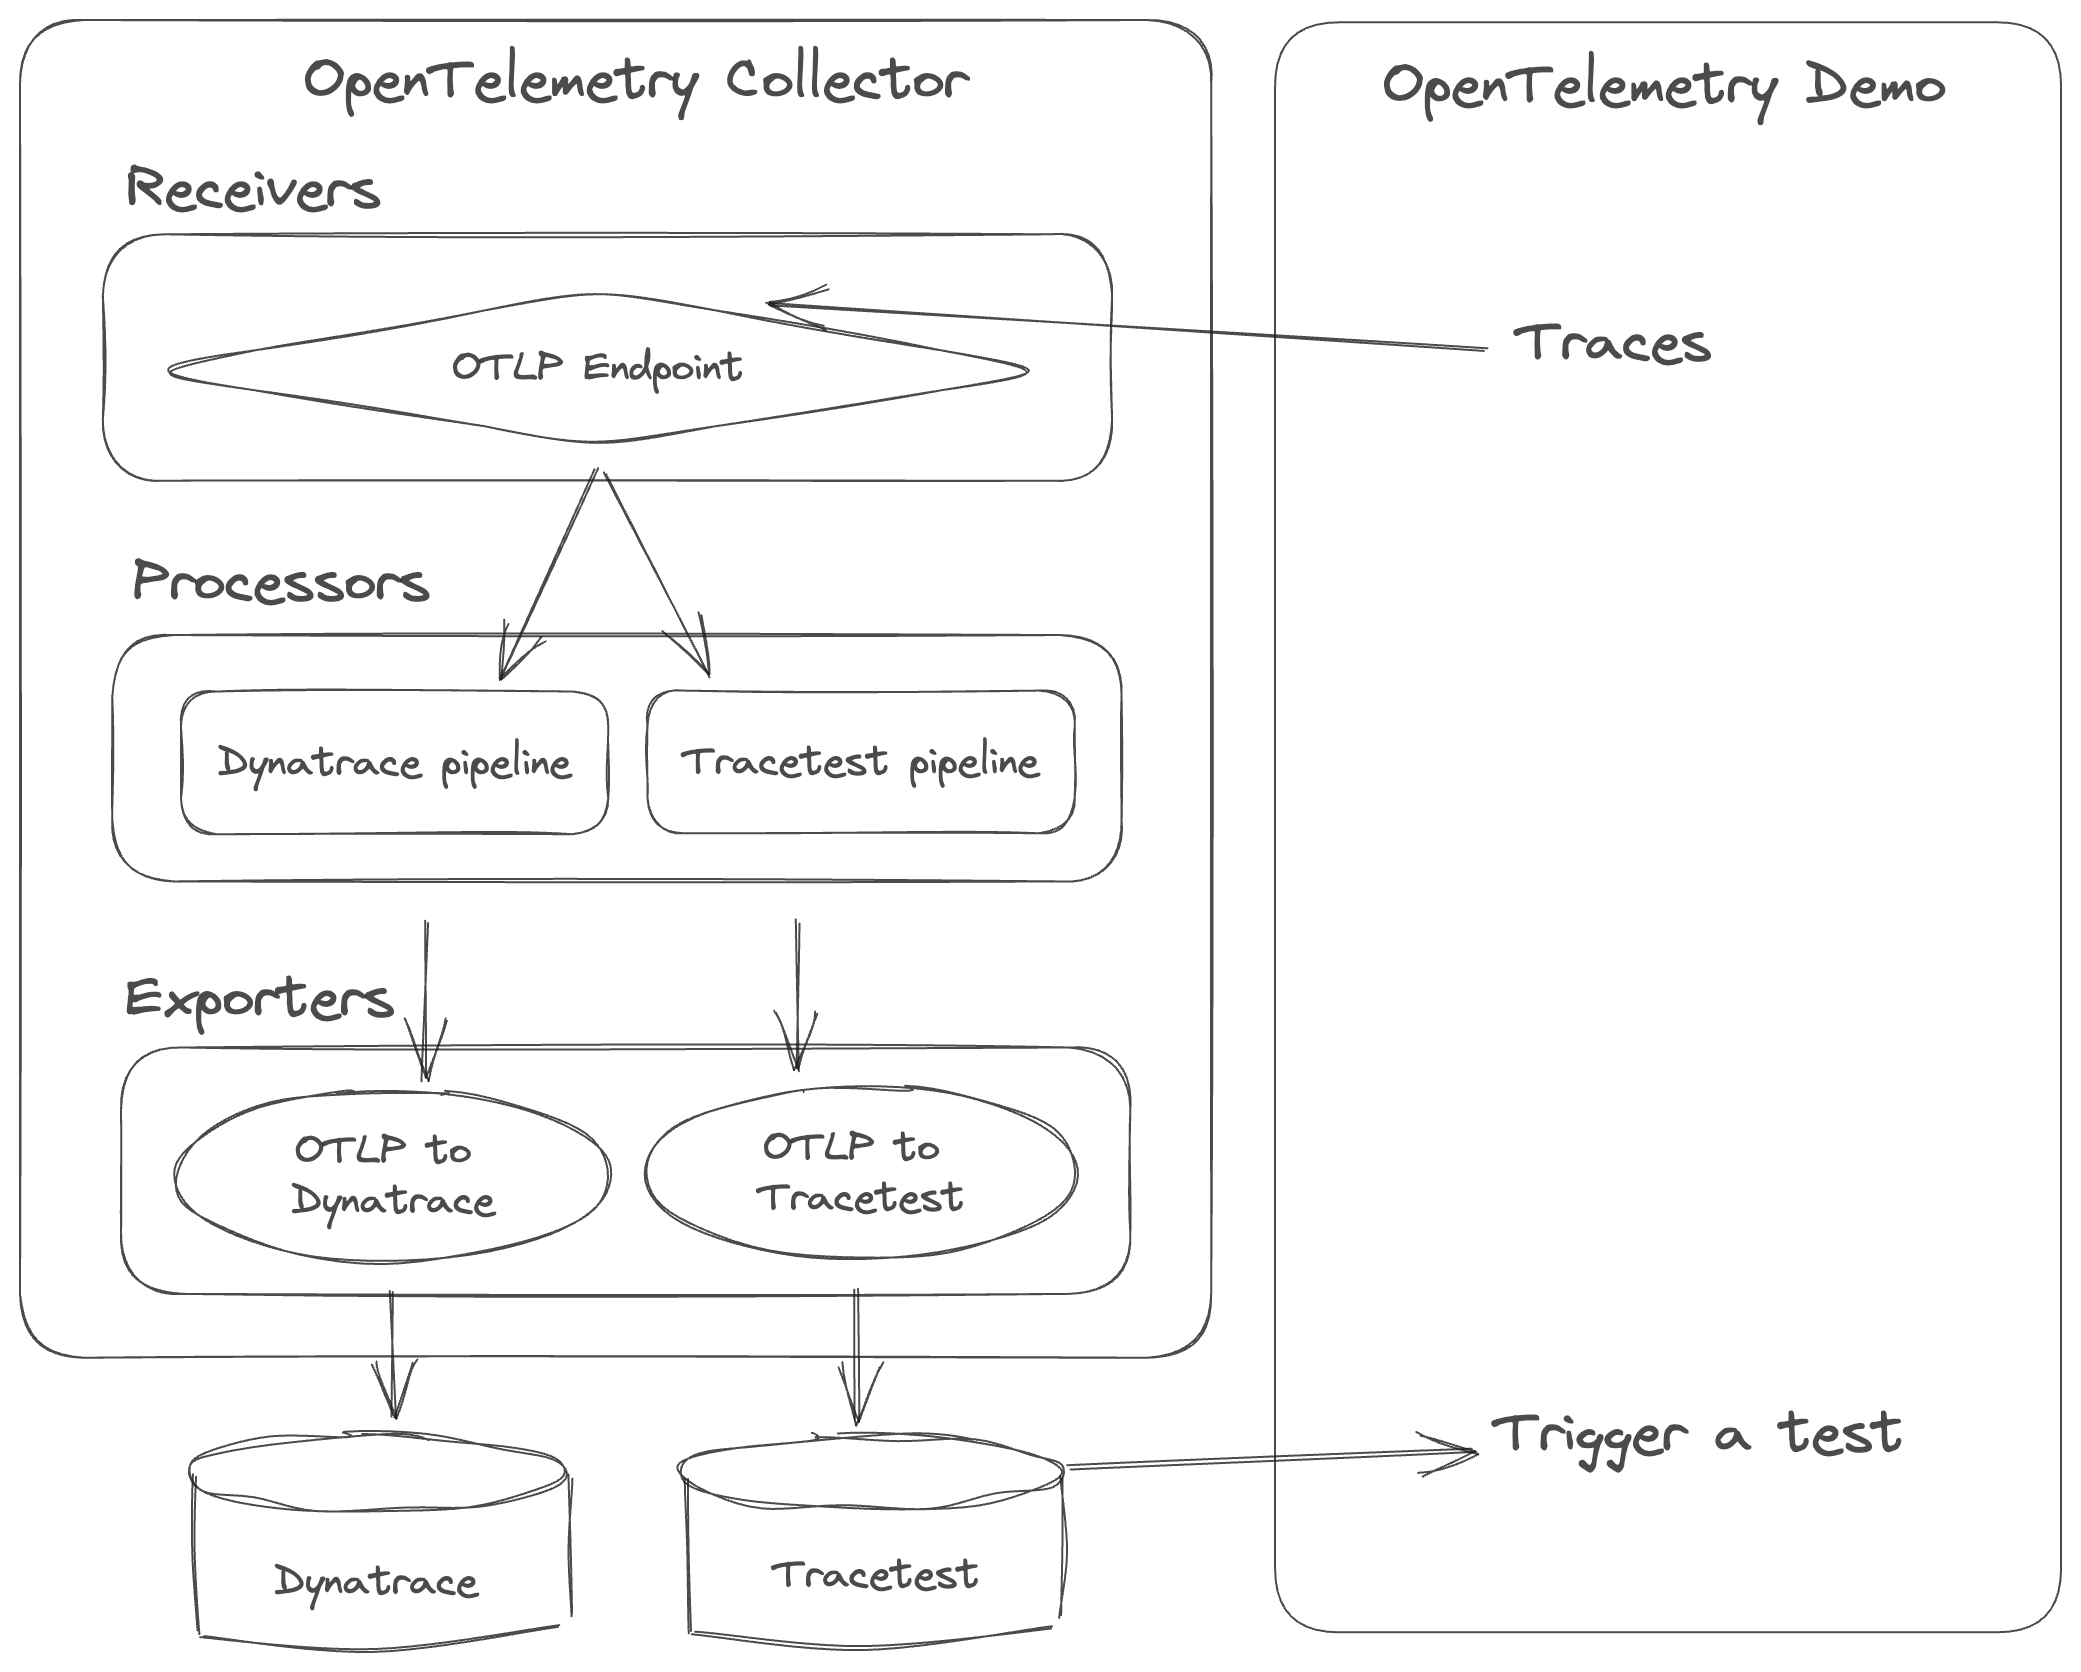
_Image 1: In this example, you see the architecture overview._
When running integration tests, it's hard to pinpoint where an HTTP transaction fails in a network of microservices. Tracetest tackles this by letting you run tests with assertions using existing trace data across all services. These tests can then be seamlessly integrated into your CI/CD process to ensure your system works well and to catch any regressions.
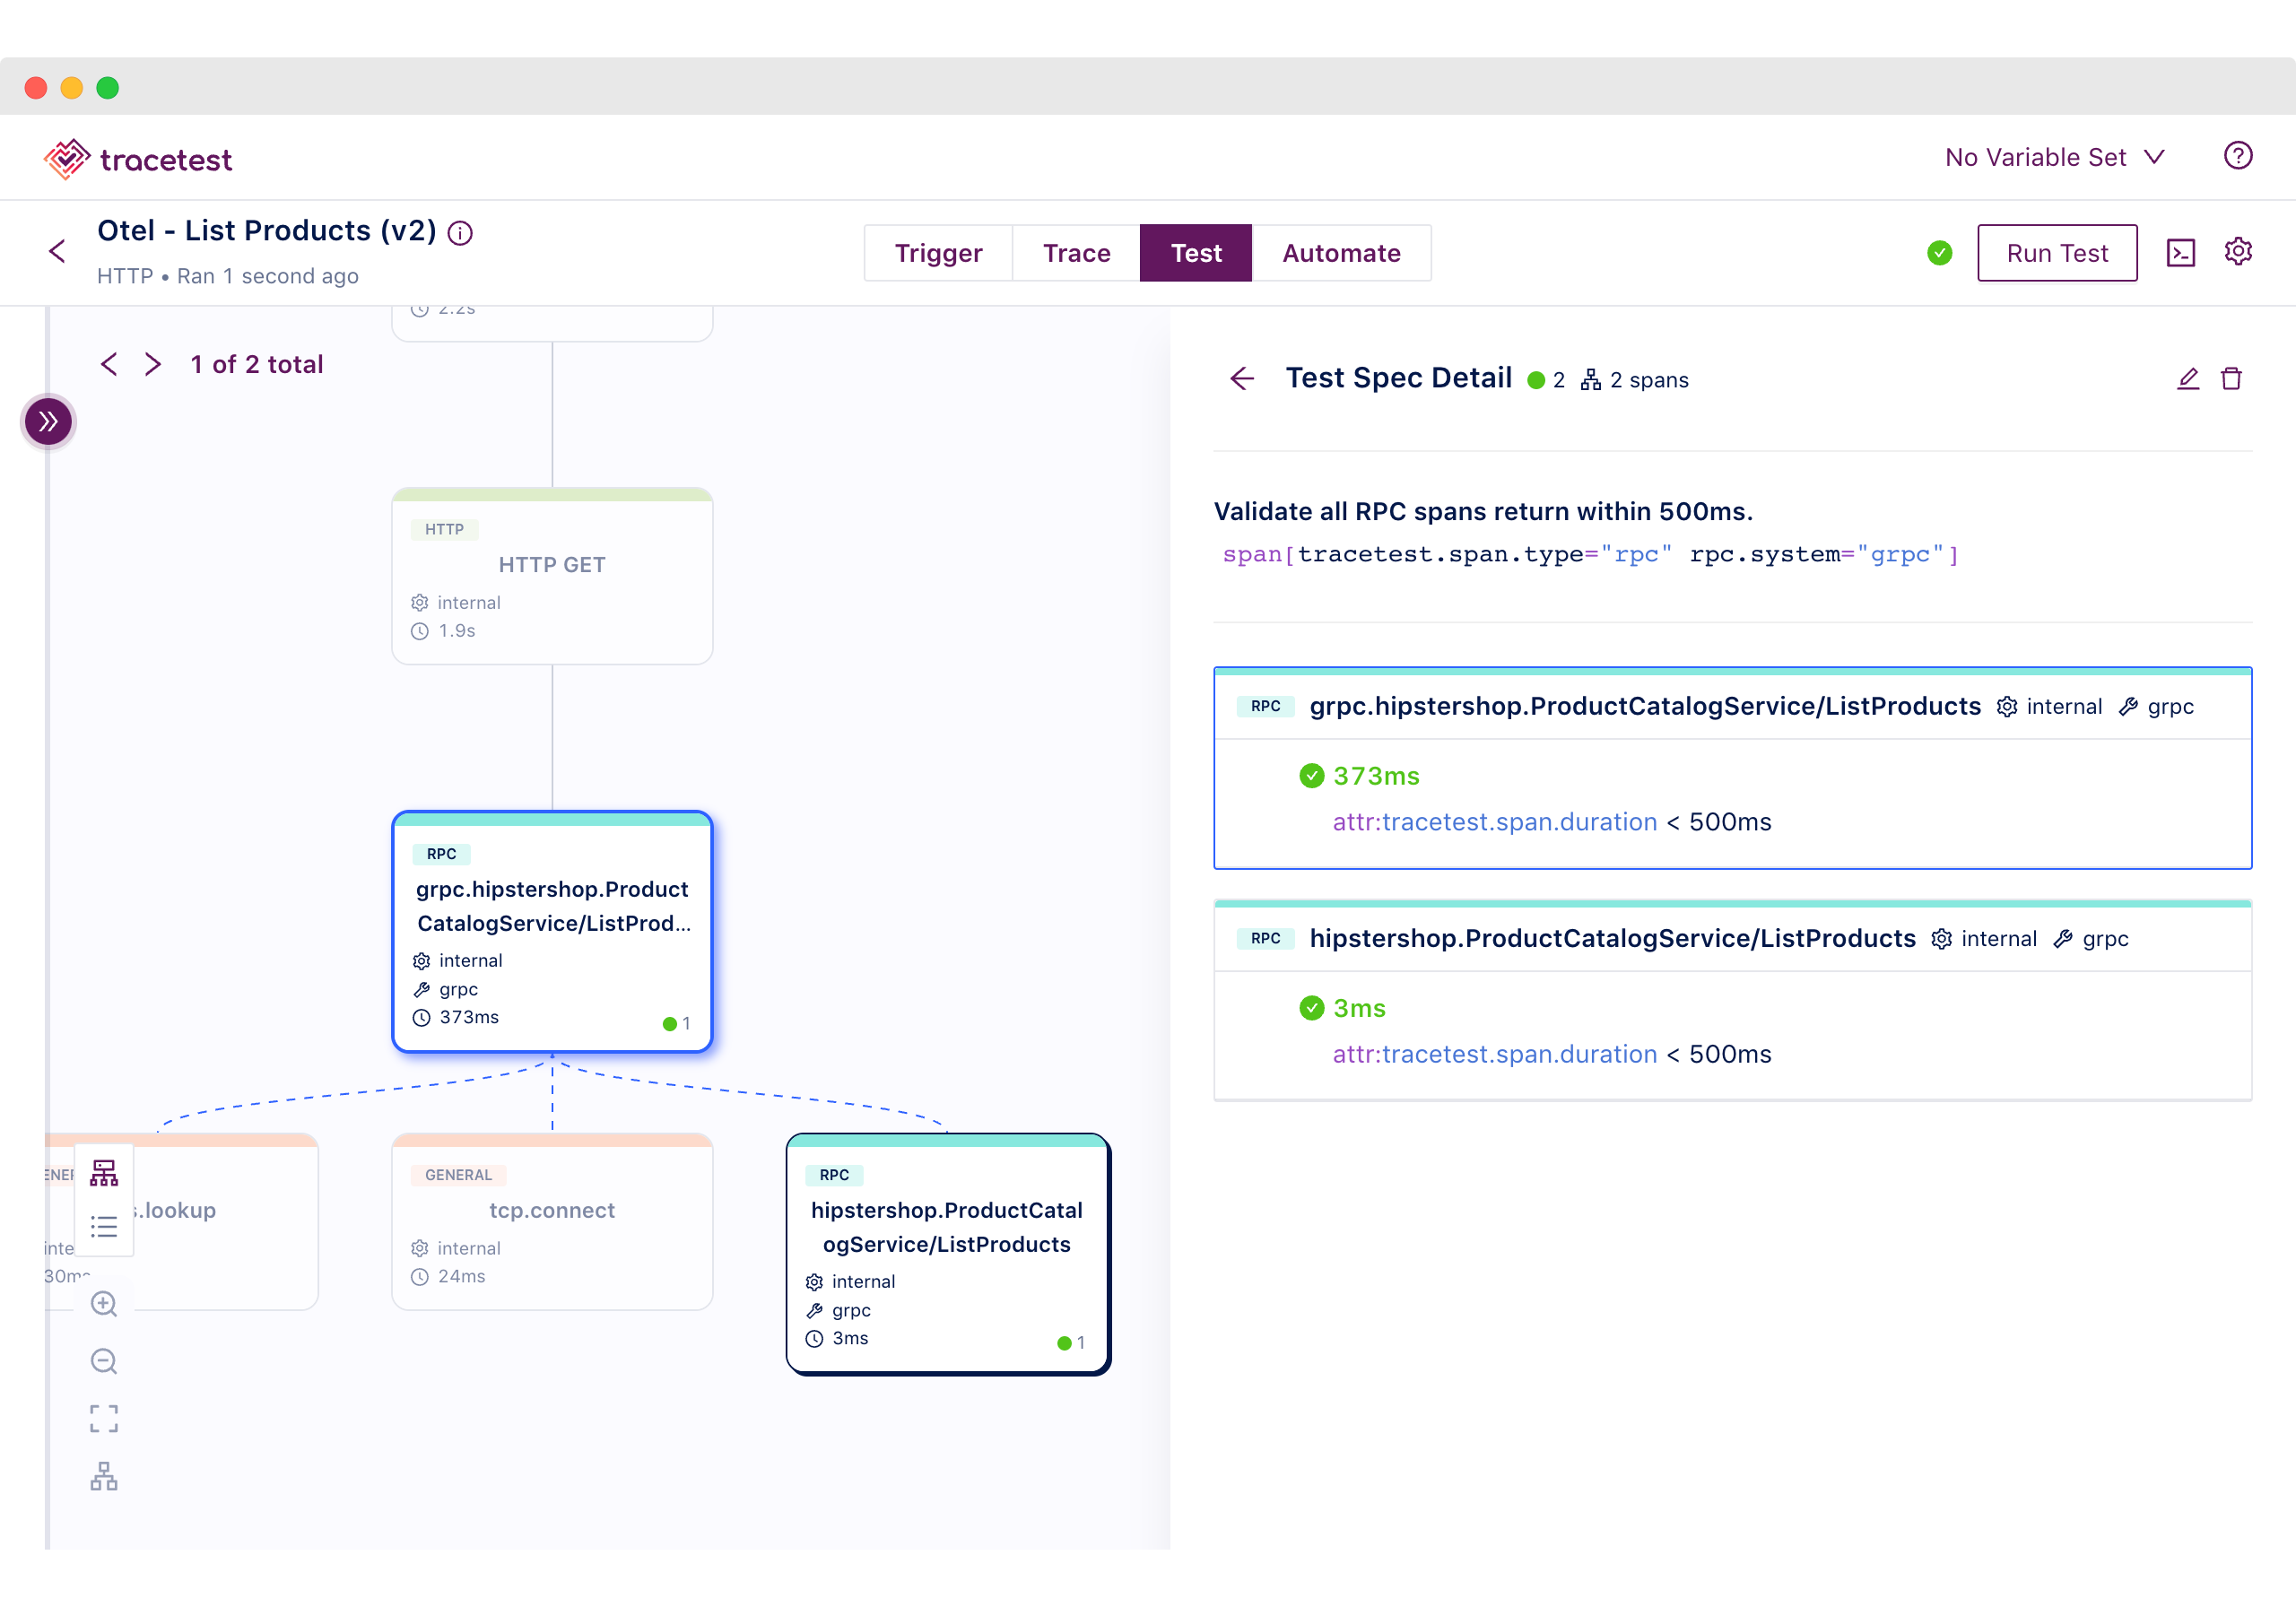
_Image 2: In this example, within the Tracetest Web UI you can see that a test assertion for all RPC trace spans succeeded because they took less than 500ms to complete._
Elevate your testing approach by harnessing Tracetest for test creation and Dynatrace for comprehensive test result analysis. Dynatrace empowers you to monitor test executions, establish connections between relevant services across different time frames and gain valuable perspectives on system performance. This combination enables you to understand system behavior, gives you insights into system performance and highlights the impact of changes on performance.
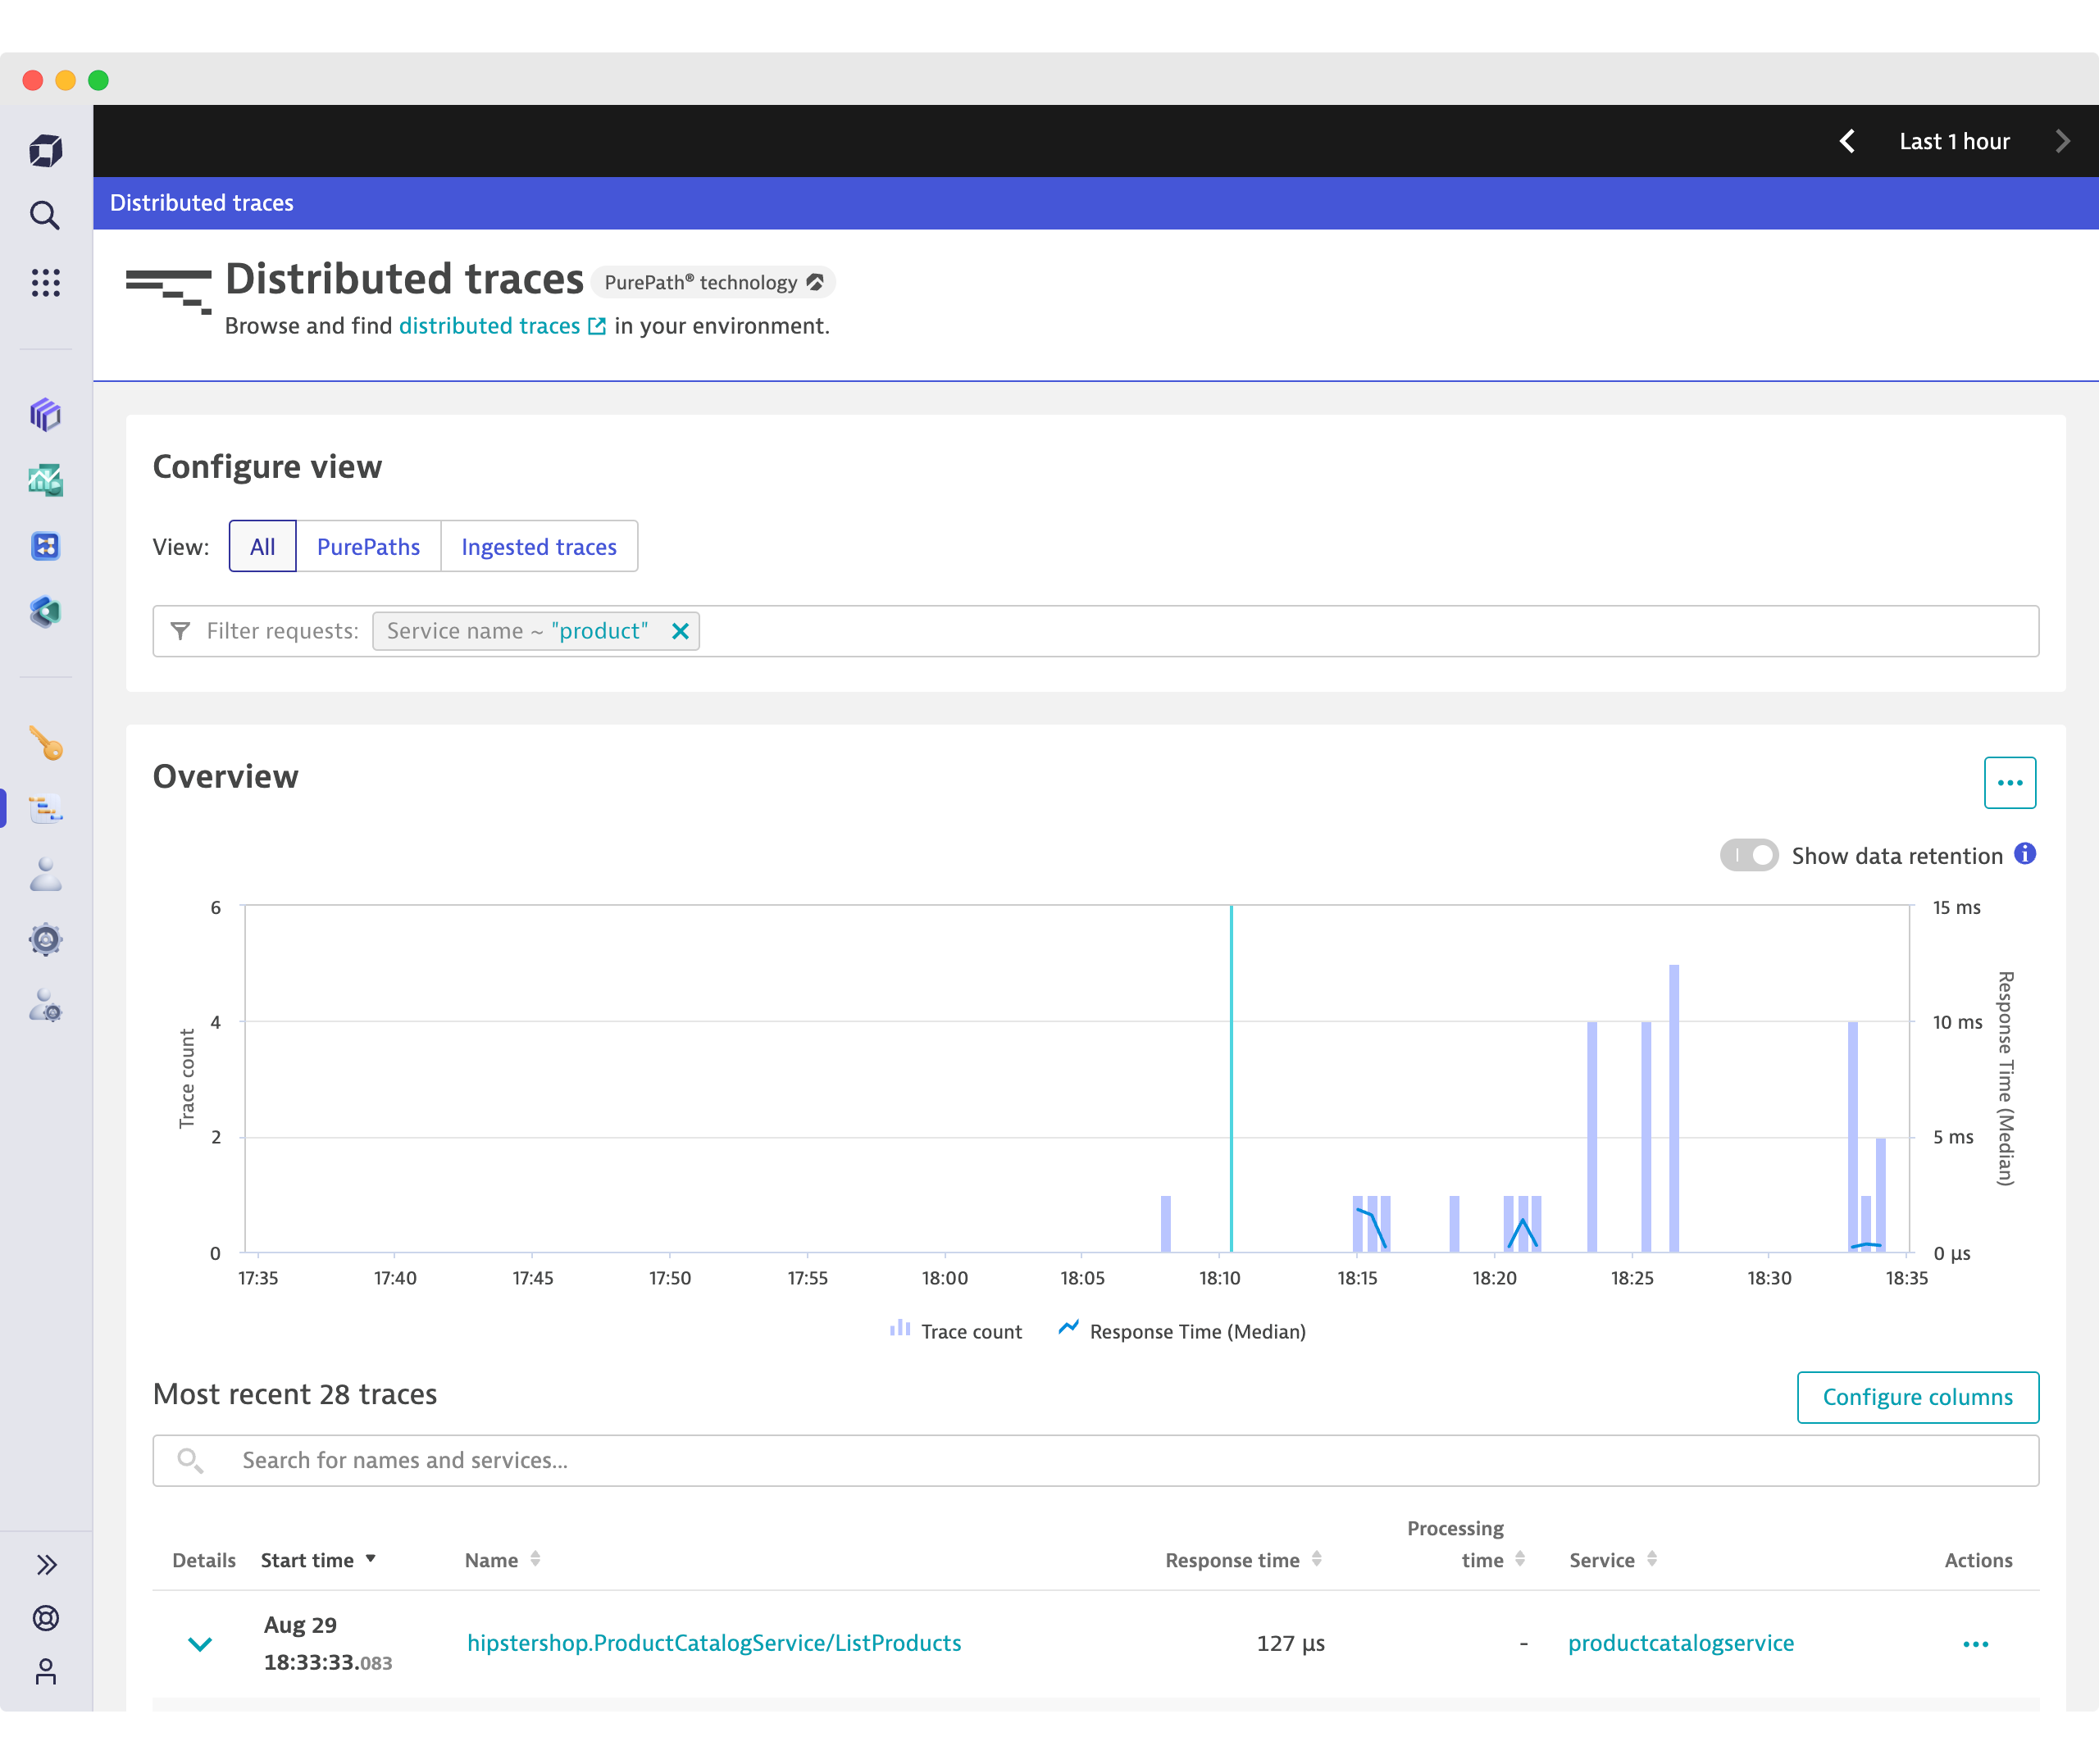
_Image 3: Traces triggered by Tracetest are surfaced in Dynatrace’s Distributed traces page._
When using Tracetest, a good way to find problems is by checking trace data in Dynatrace. Any problems you find can then become new tests or points to check in Tracetest. This keeps things improving in a continuous loop.
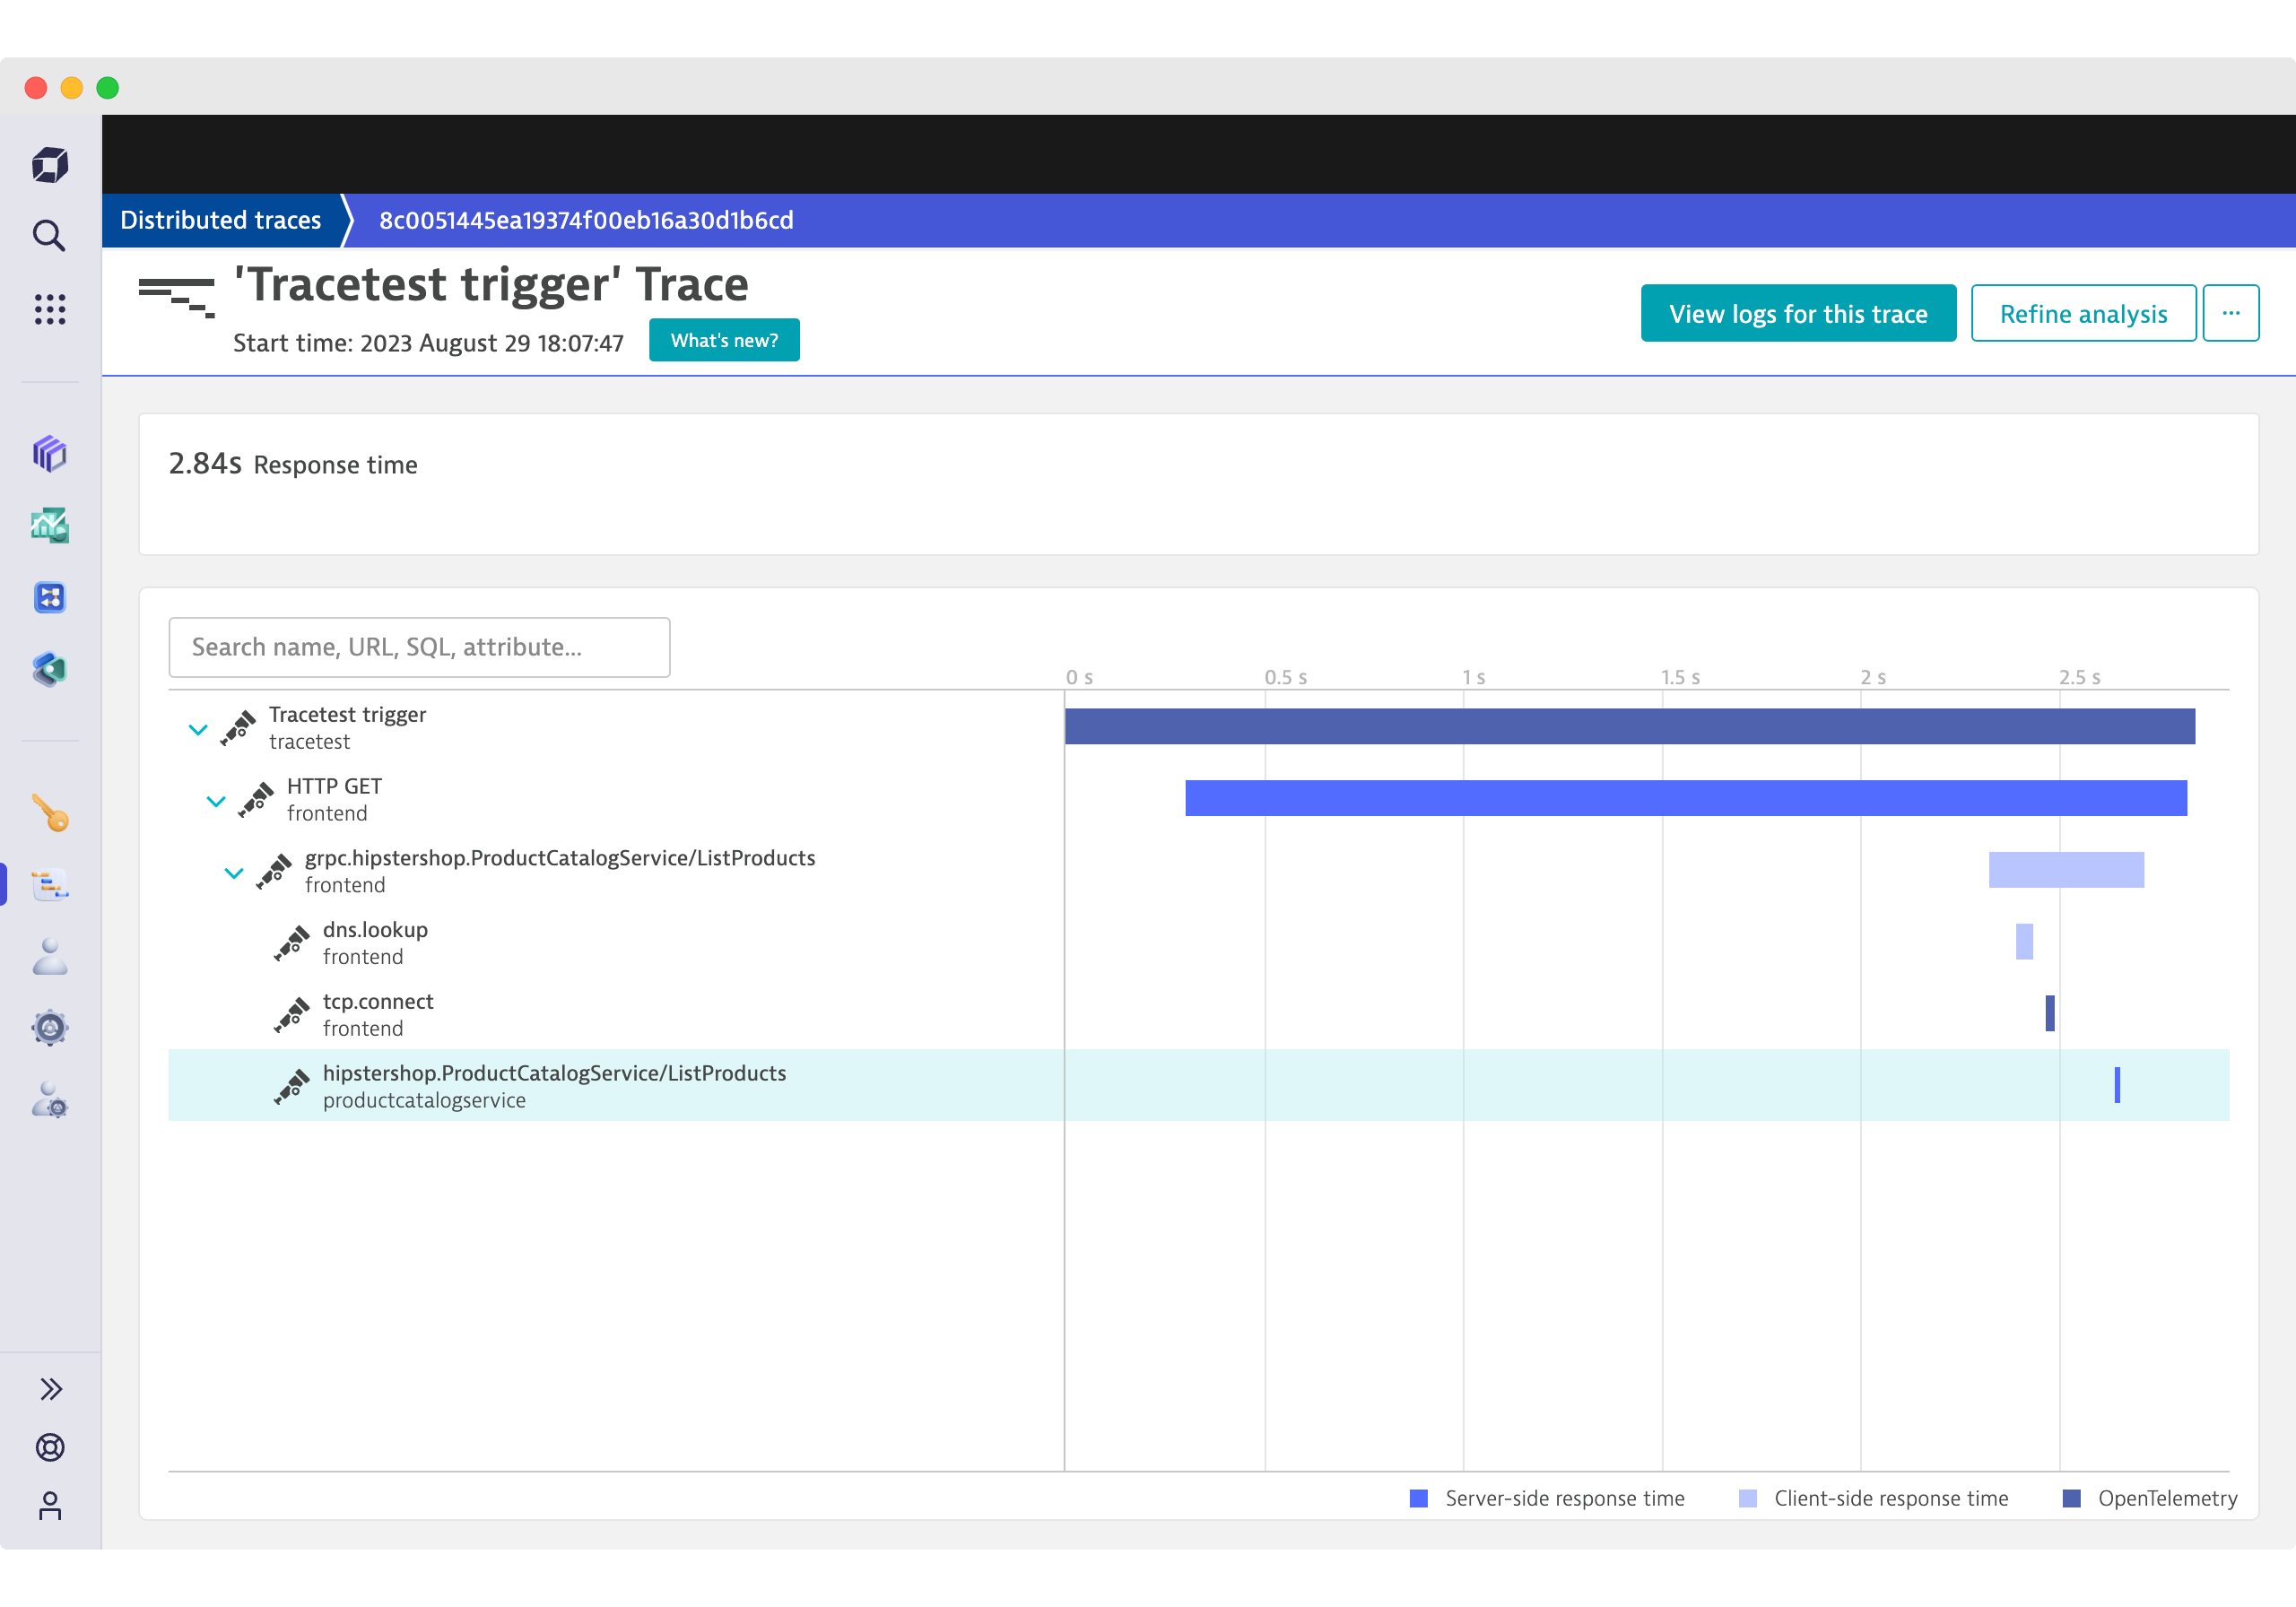
_Image 4: Here you see a trace drilldown of a test in the Dynatrace UI._
## Try Tracetest with Dynatrace
Install Dynatrace by signing up for a [free trial](https://dynatrace.com/trial) then configure your OpenTelemetry collector to send traces to Dynatrace (see below).
Tracetest is open-source and easy to install. Start by installing the Tracetest CLI:
```bash
brew install kubeshop/tracetest/tracetest
```
From here, follow the [official documentation](https://docs.tracetest.io/getting-started/installation) to install the Tracetest server. Once the server is installed, open the Tracetest Web UI in the browser and follow the instructions for connecting the [OpenTelemetry Collector](https://opentelemetry.io/docs/collector/) with Tracetest.
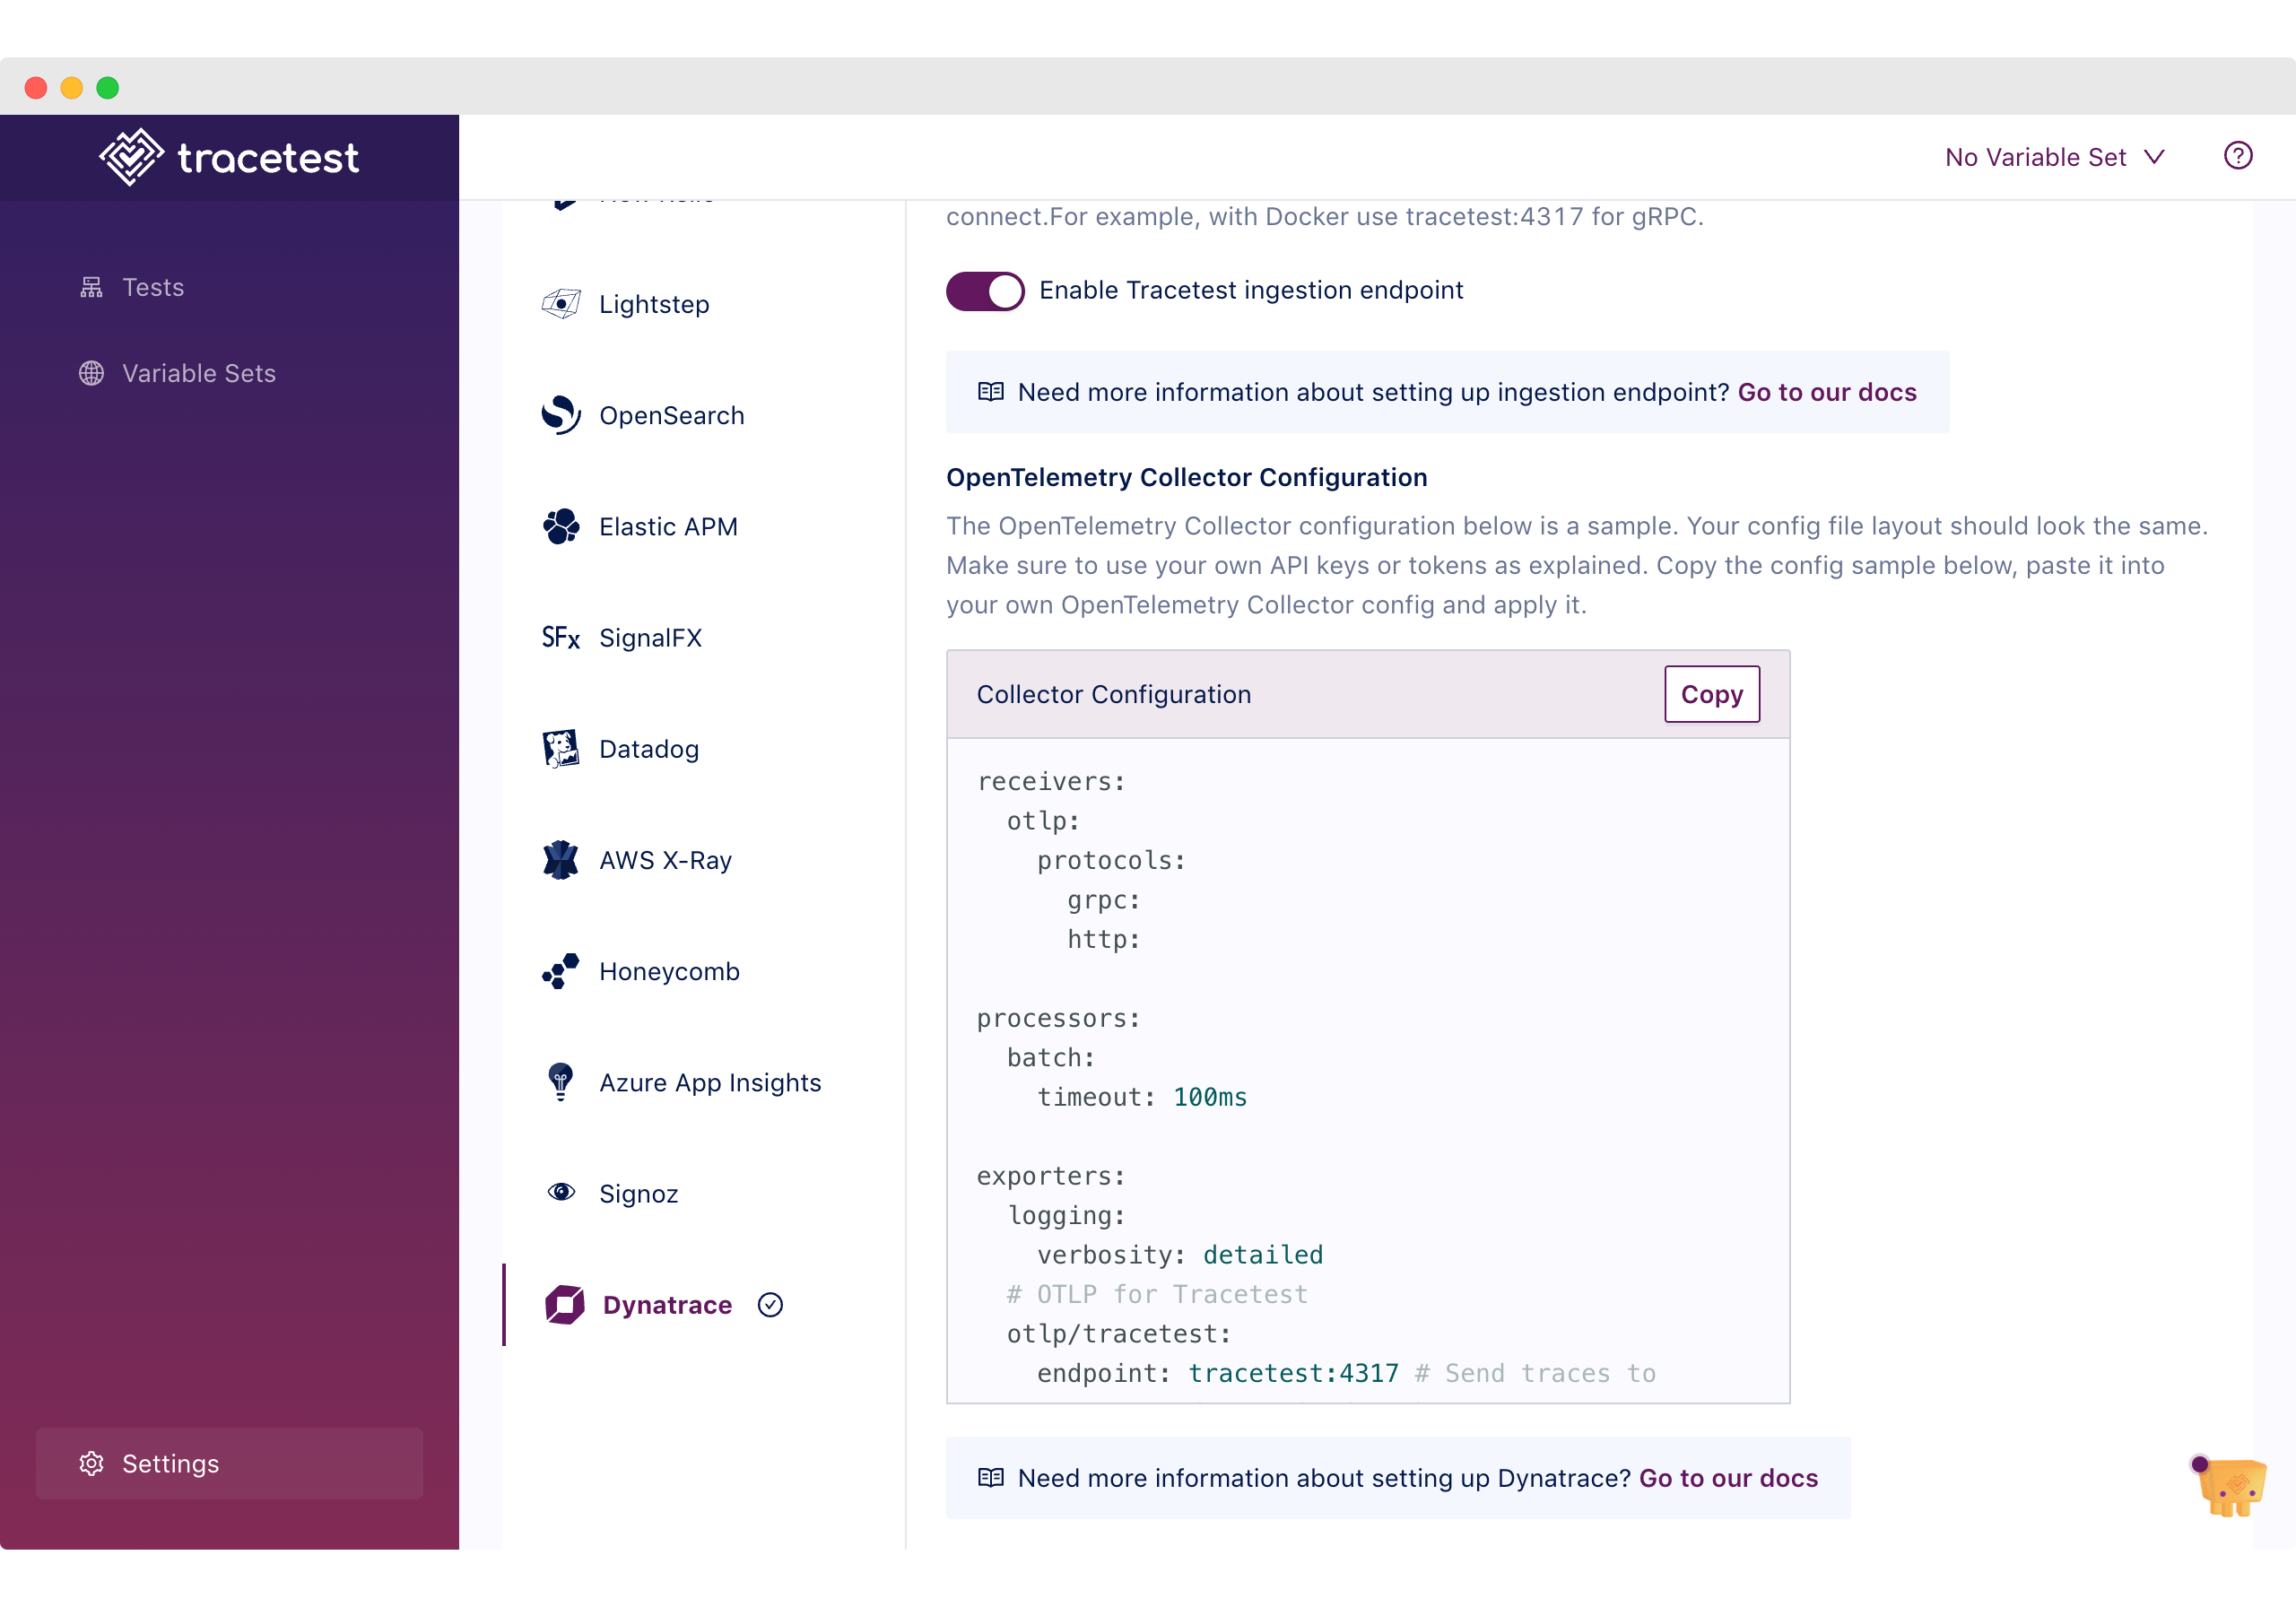
_Image 5: Selecting Dynatrace in the Tracetest settings._
The [Collector](https://opentelemetry.io/docs/collector/) is the recommended way to send OpenTelemetry data to an observability back-end. It is a highly configurable binary that allows you to ingest, process, and export OpenTelemetry data.
Enabling the Tracetest/Dynatrace integration is as simple as configuring your OpenTelemetry collector to send spans to both Tracetest and Dynatrace.
Copy this OpenTelemetry Collector configuration and paste it into your own configuration file.
```yaml
receivers:
otlp:
protocols:
grpc:
http:
processors:
batch:
timeout: 100ms
exporters:
logging:
logLevel: debug
# OTLP for Tracetest
otlp/tracetest:
endpoint: tracetest:4317
tls:
insecure: true
# OTLP HTTP for Dynatrace
otlphttp/dynatrace:
endpoint: https://your-env-id.live.dynatrace.com/api/v2/otlp
headers:
Authorization: "Api-Token dt0c01.sample.secret"
# Requires "openTelemetryTrace.ingest" permission
service:
pipelines:
traces/tt:
receivers: [otlp]
processors: [batch]
exporters: [otlp/tracetest]
traces/ls:
receivers: [otlp]
processors: [batch]
exporters: [logging, otlphttp/dynatrace]
```
Next, edit the config to include your Dynatrace API token.
## Create a Trace-based Test in Tracetest
For this example, we’ll use the official example app for Tracetest and Dynatrace. To quickly access the example, you can run the following:
```bash
git clone https://github.com/kubeshop/tracetest.git
cd tracetest/examples/tracetest-dynatrace/
docker compose -f ./docker-compose.yaml -f ./tracetest/docker-compose.yaml up --build
```
Make sure to add your API key as shown in the section above.
To create a test in Tracetest, start by clicking Create > Create New Test > HTTP Request > Next > Add a name for your test > Next > The URL field should be `http://frontend:8084/api/products` > Create and Run.
This will trigger the test and display a distributed trace in the Trace tab. You’ll also see the results of the Trace Analyzer. These results show rules and conventions to adhere to while writing code instrumentation.
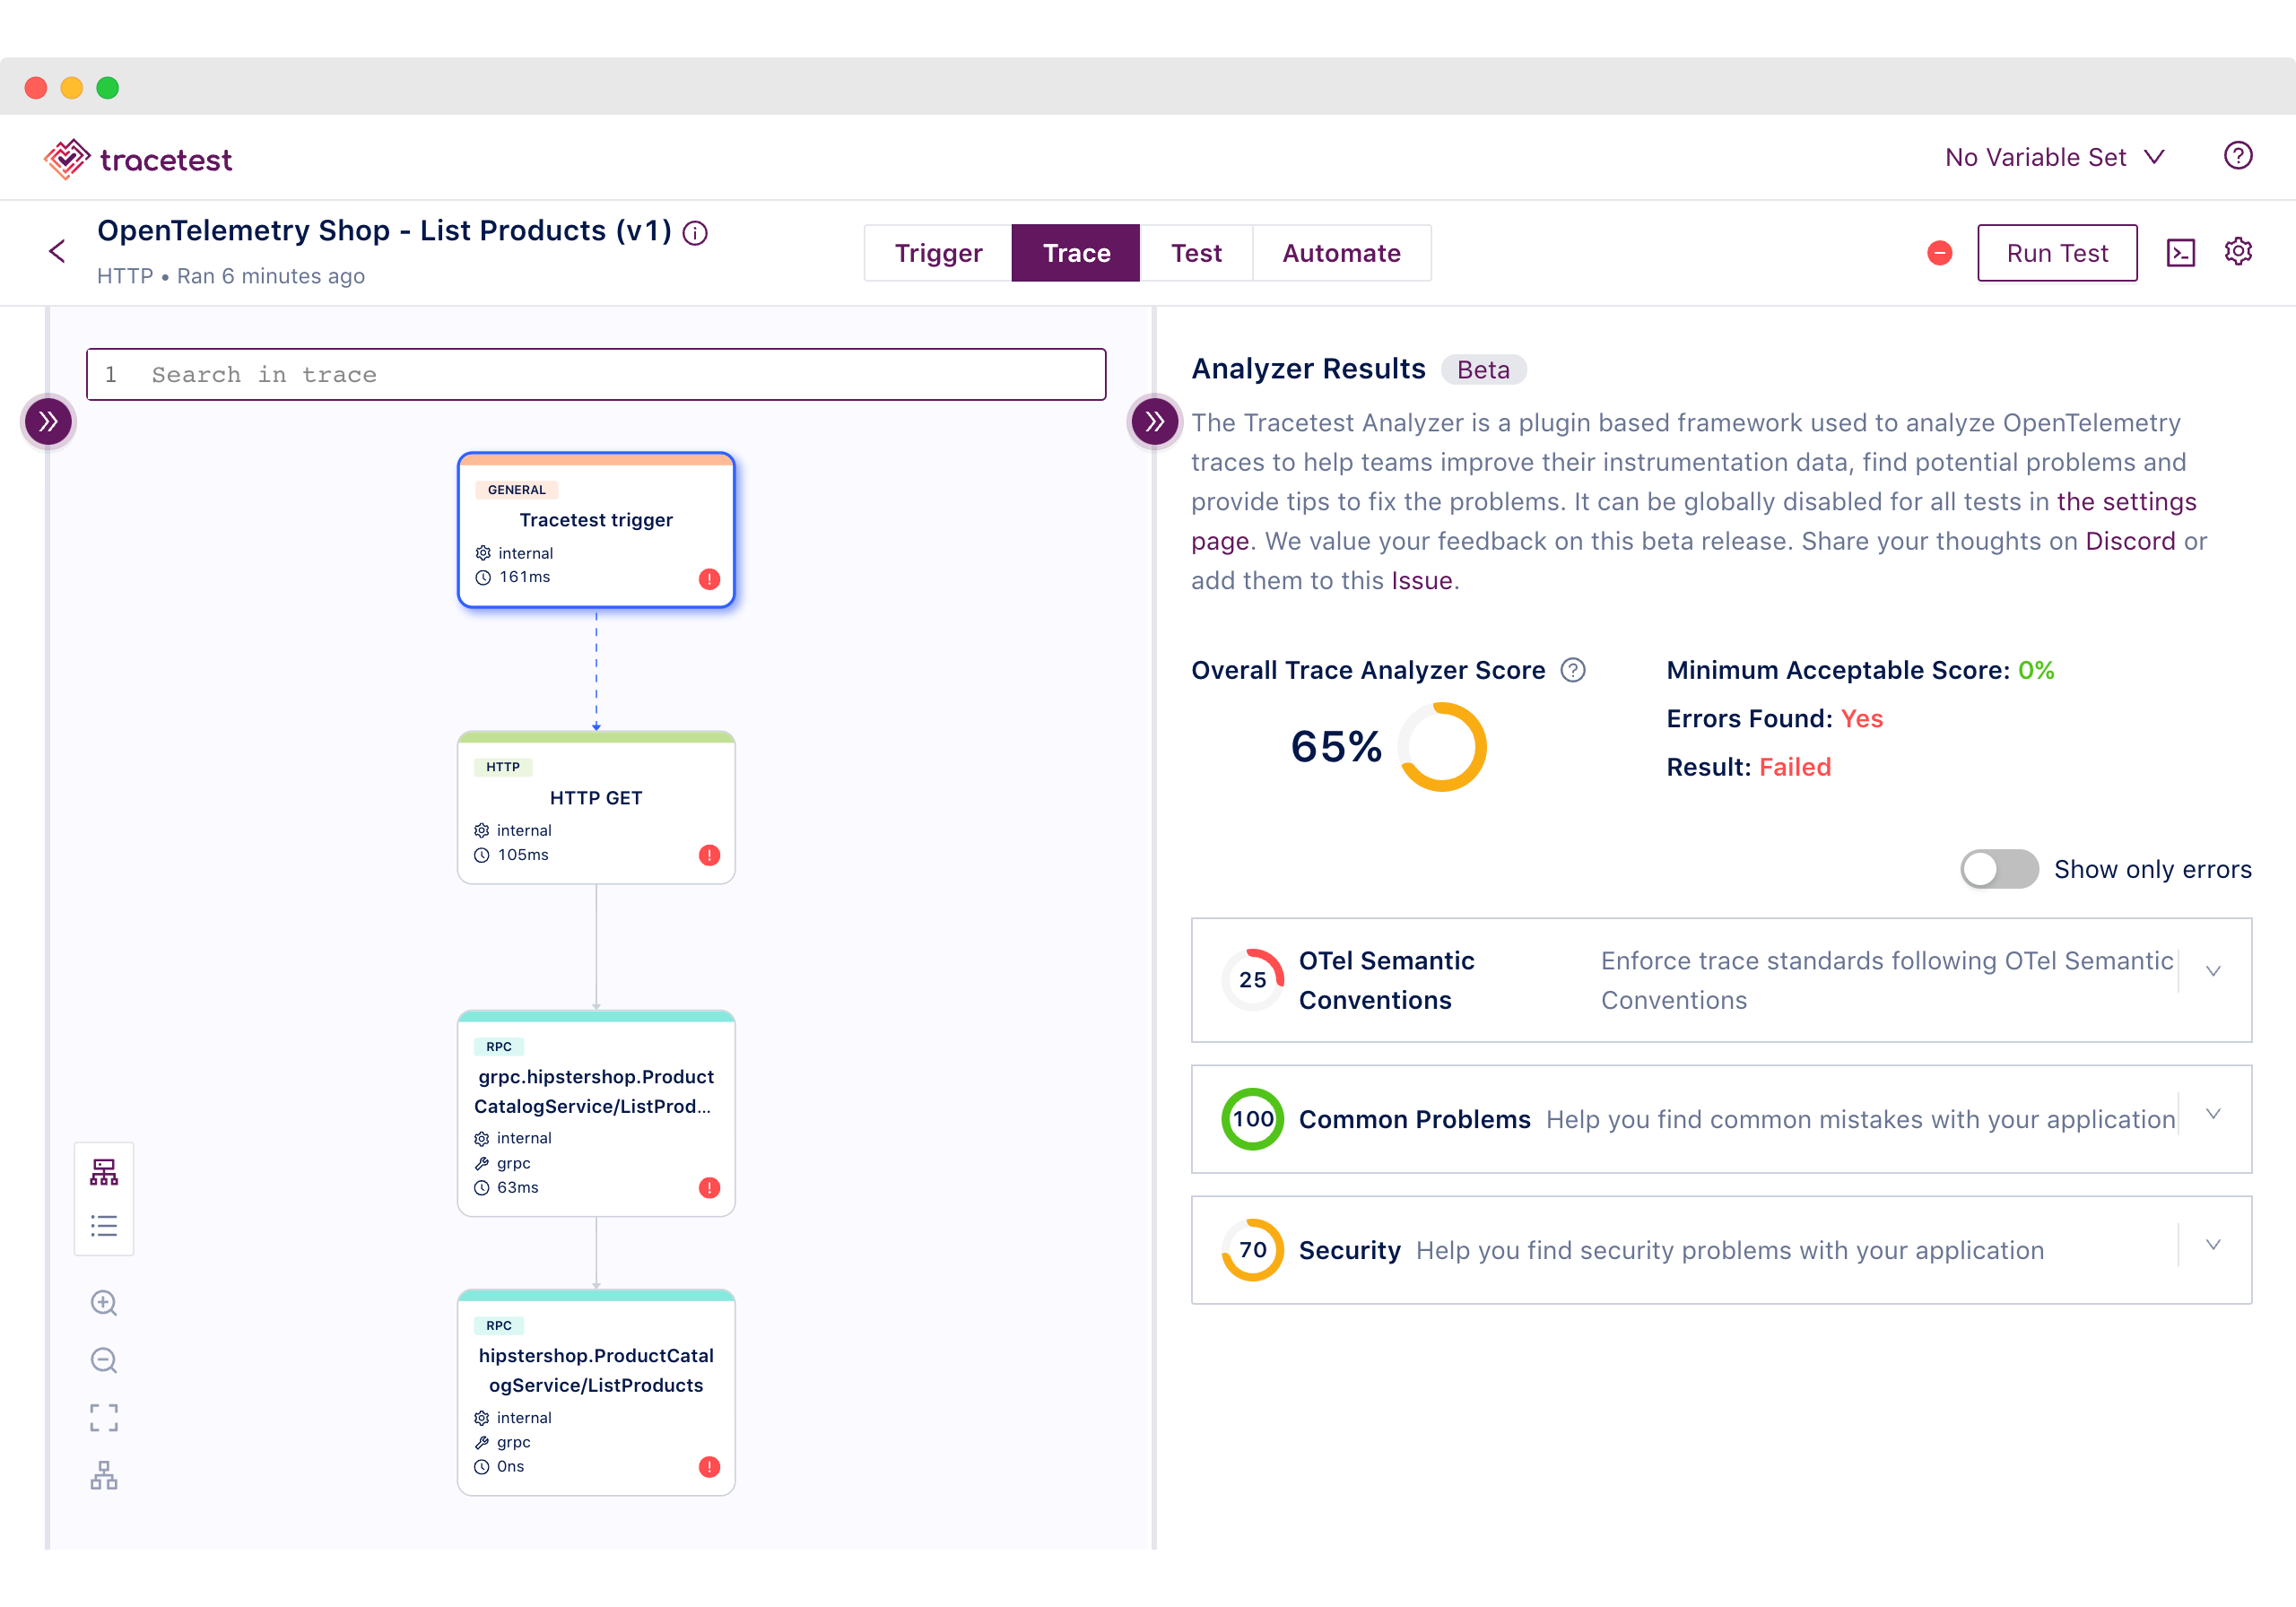
_Image 6: Trace Analyzer in the Tracetest Web UI. Validate the quality of the code instrumentation._
Proceed to add a test spec to assert that all RPC requests return within `500 ms`. Click the Test tab and proceed to click the Add Test Spec button.
In the span selector, make sure to add this selector:
```css
span[tracetest.span.type="rpc"]
```
It will select the database spans.
In the assertion field, add:
```css
attr:tracetest.span.duration < 500ms
```
Save the test spec and publish the test.
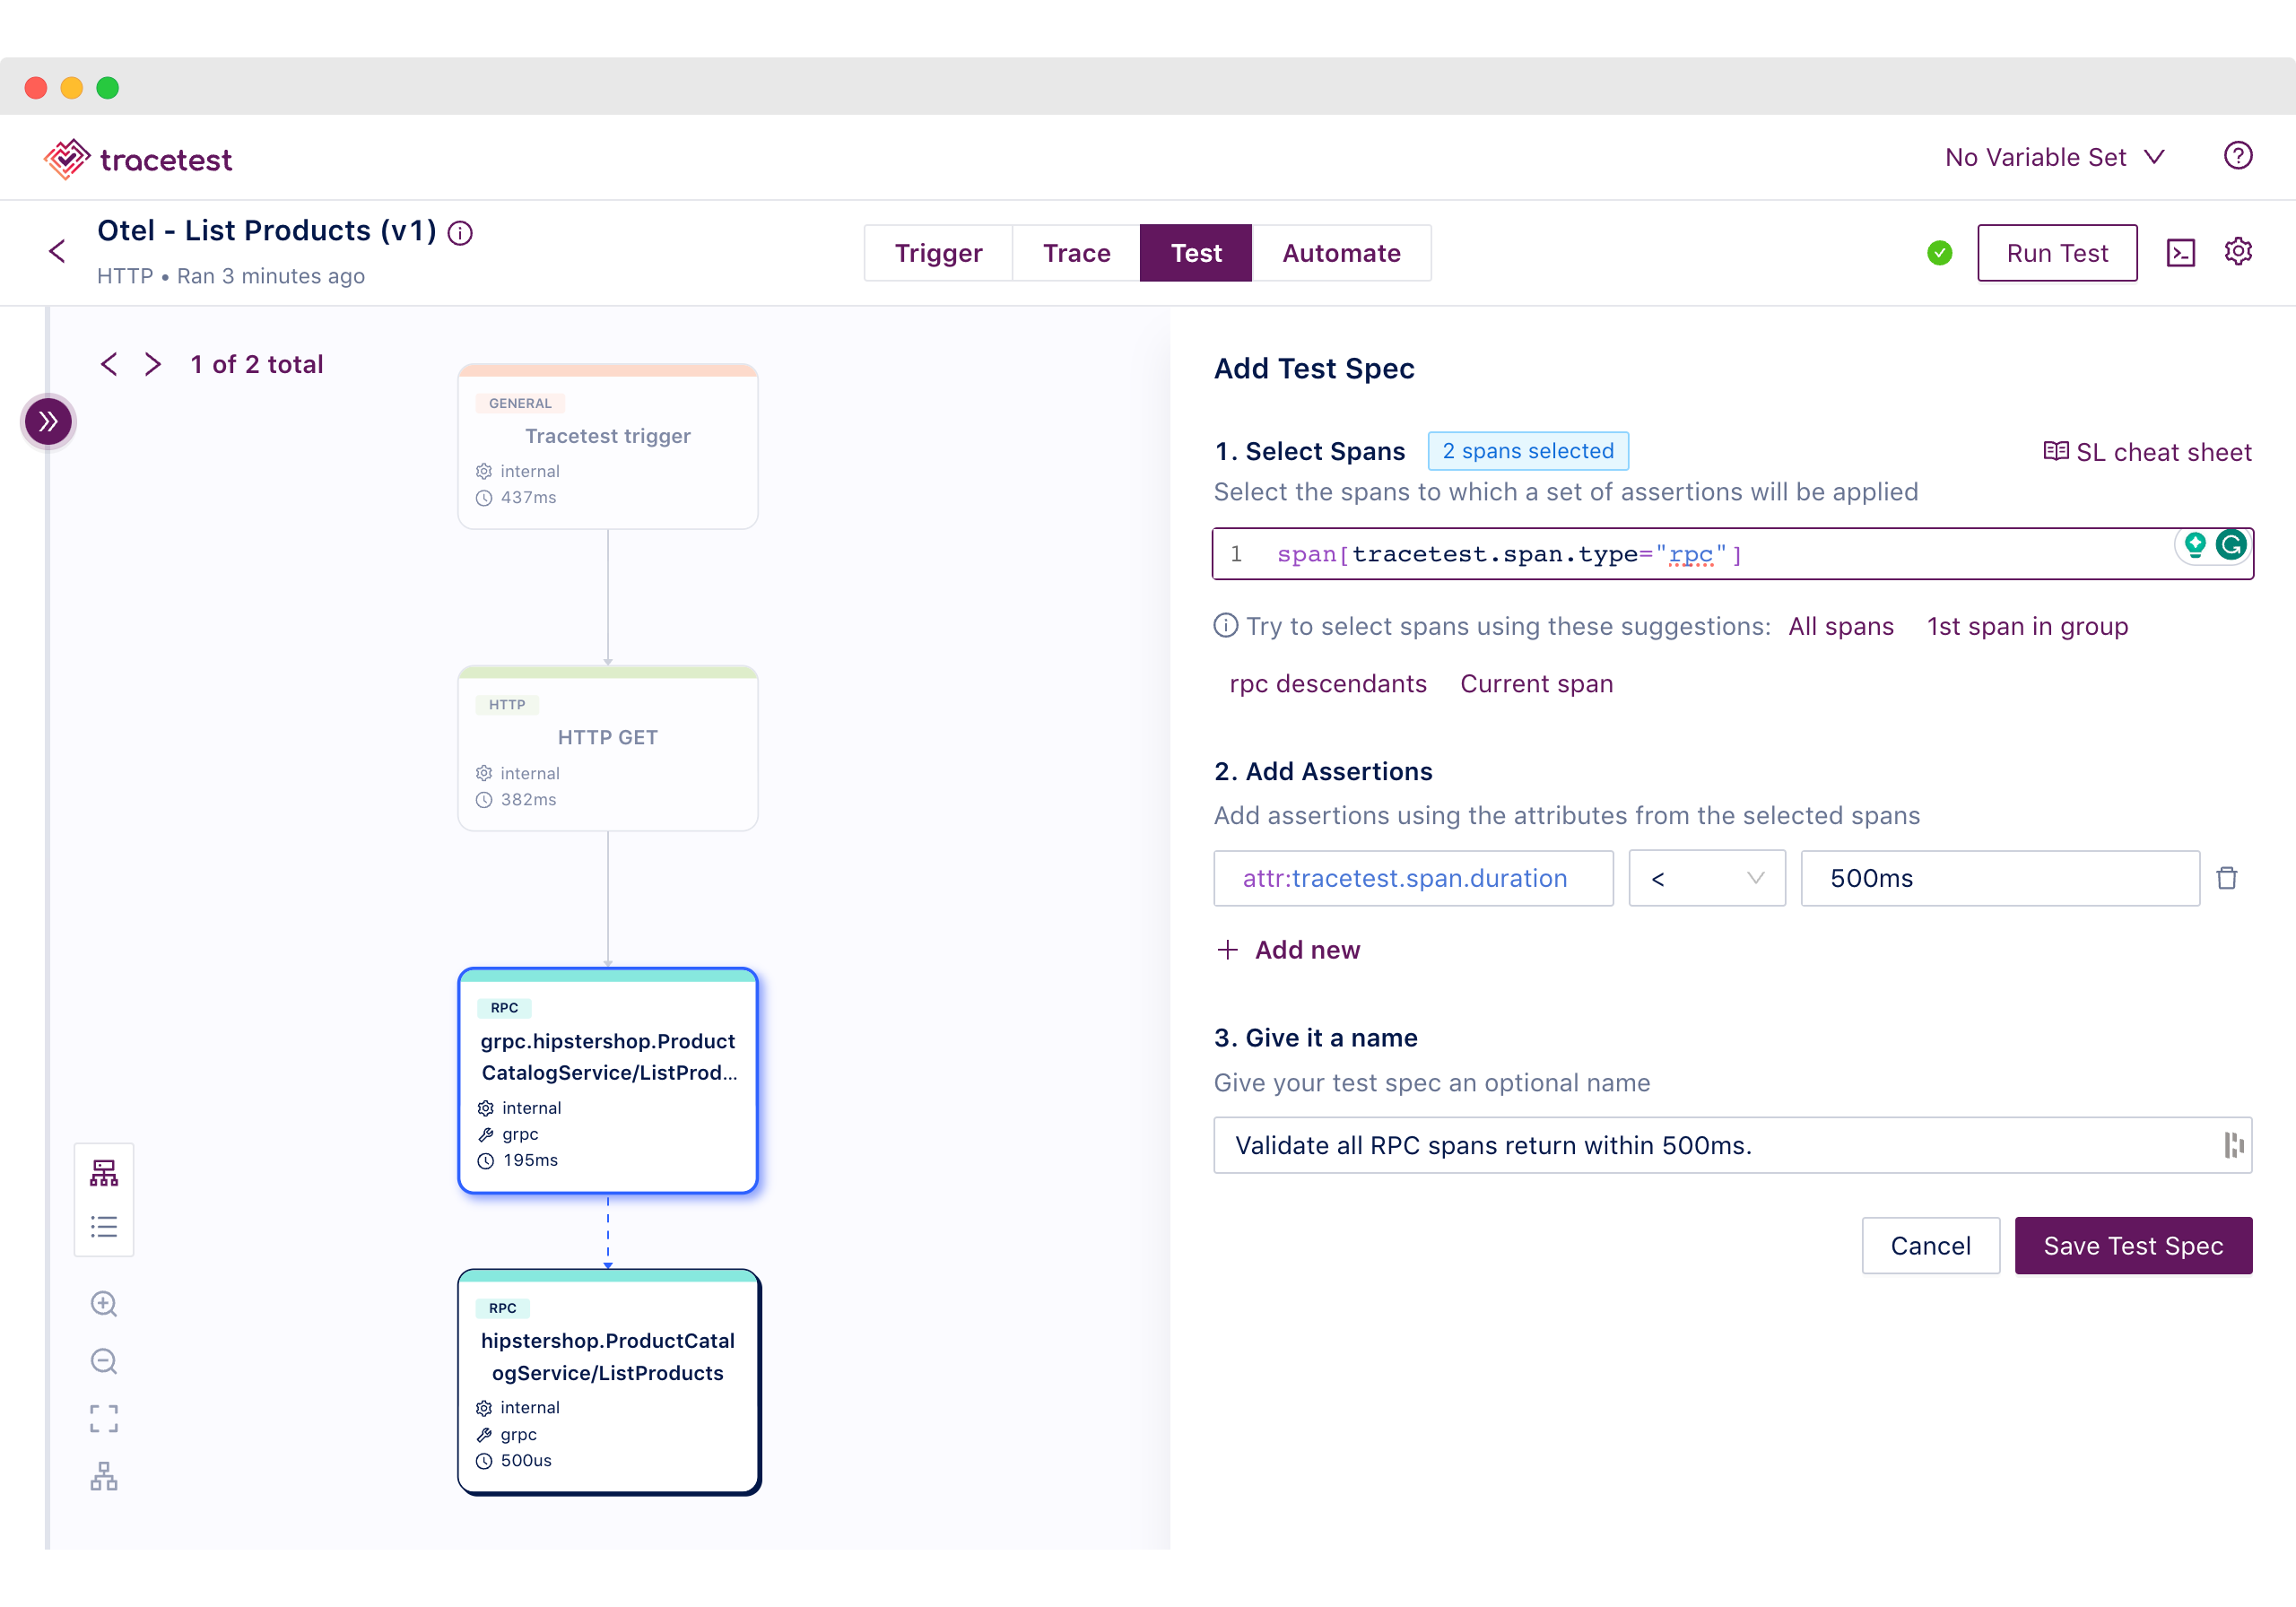
_Image 7: Adding assertions to a test in the Tracetest Web UI._
If an RPC span is returning in more than 500ms it will be labeled in red. This is an example of a trace-based test that can assert against every single part of an HTTP transaction, including external API calls. (See image 2)
However, Tracetest cannot give you a historical overview of all test runs. Let's show how Dynatrace makes it possible.
## Monitor Trace-based Tests Over Time with Dynatrace
Because you are using two pipelines in the OpenTelemetry Collector, all distributed traces generated will be stored in Dynatrace. Additionally, if you configure the Tracetest server with [Internal Telemetry](https://docs.tracetest.io/configuration/telemetry), you will see the traces the Tracetest server generates in Dynatrace. Using the example above, traces from the services in the OpenTelemetry Demo will be stored in Dynatrace with defined **Service** properties, while the traces from Tracetest will be stored with the **"tracetest" Service** property.
Data in the Tracetest service will give you insight into every test run. Start by running this query in the Tracetest service to filter all Tracetest test runs.
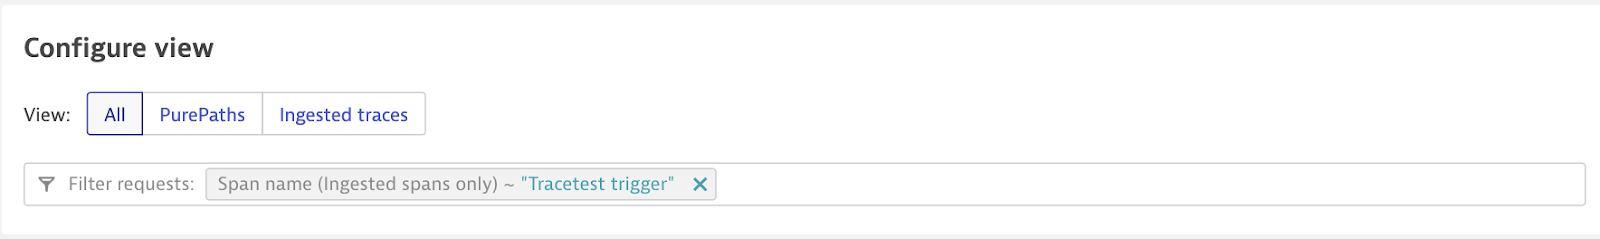
_Image 8: Filter “Tracetest trigger” traces._
The distributed traces chart will be filtered and display performance over time.
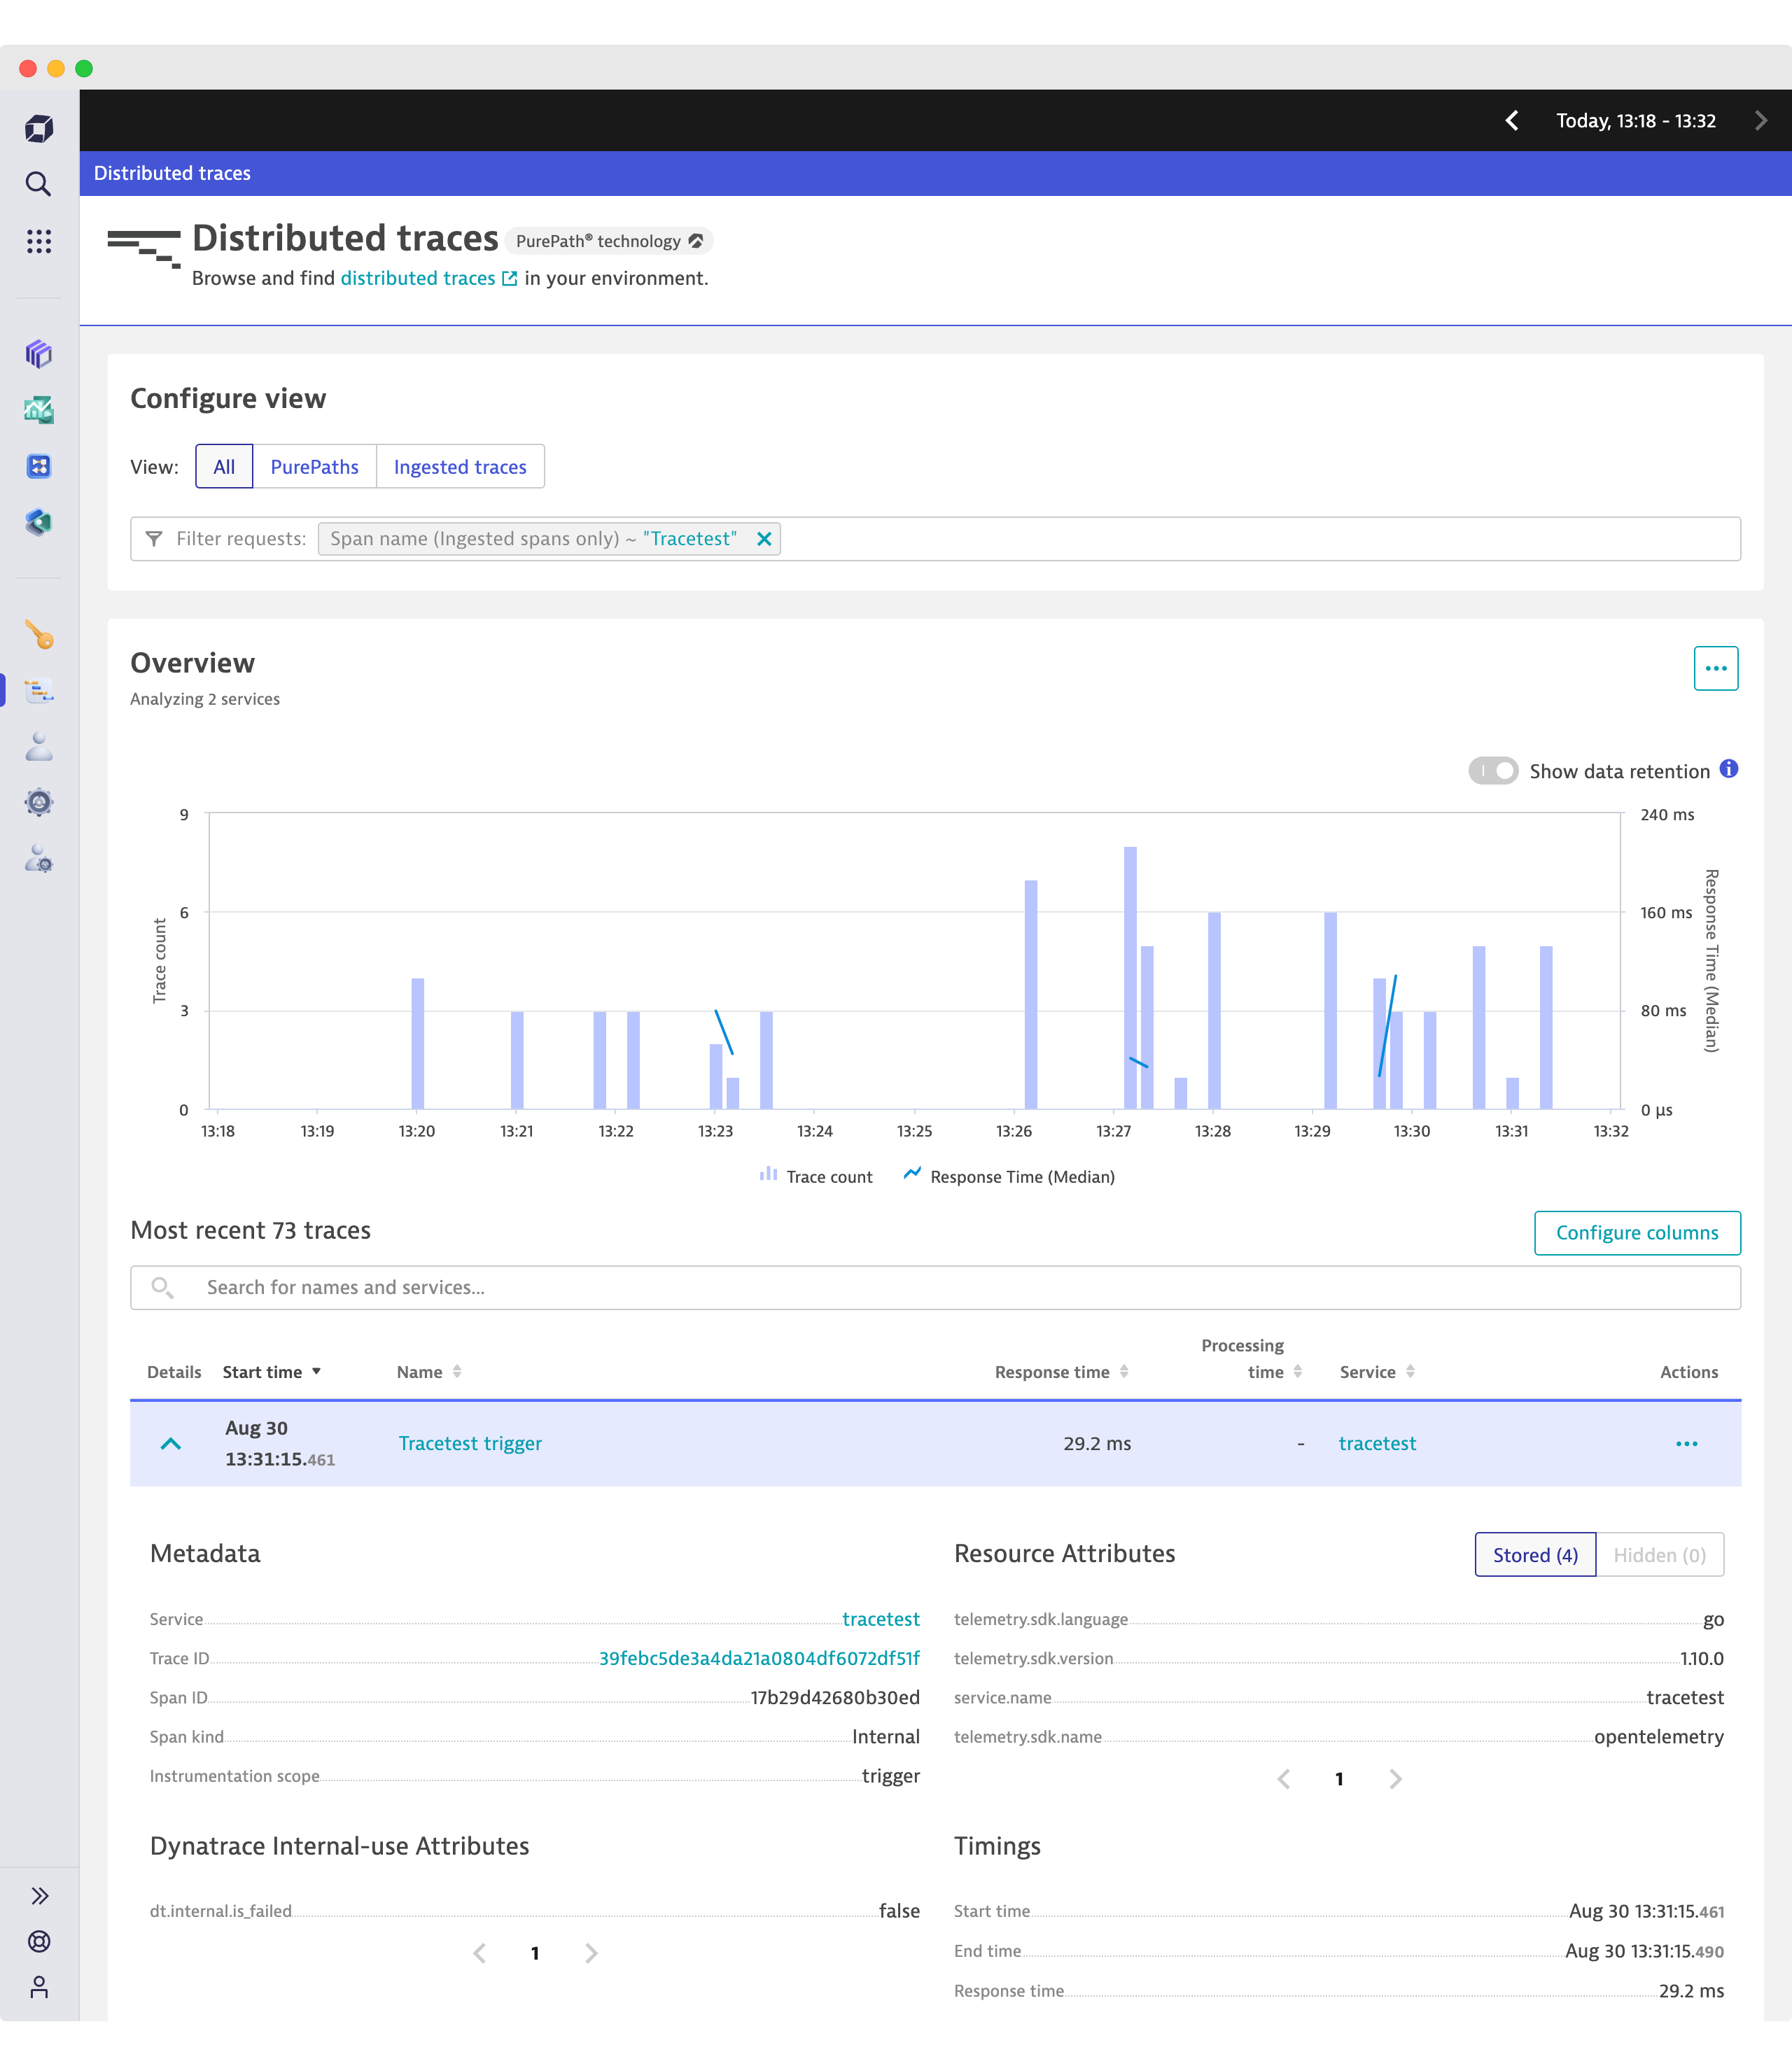
_Image 9: Show the results of the filter above. View the chart to see performance and select a distinct trace to drill down._
From here, you can drill down into the specific trace to troubleshoot. Open the **Tracetest trigger** trace. For example, choose a trace that is slow. Once open, the trace waterfall within Dynatrace can help you pinpoint exactly which span is causing an issue. (Shown in Image 4, above)
## What's next?
Would you like to learn more about Tracetest and what it brings to the table? Check the [docs](https://docs.tracetest.io/examples-tutorials/recipes/running-tracetest-with-dynatrace) and try it out today by [downloading](https://tracetest.io/download) it today!
Want to learn more about Dynatrace? [Read more here](https://www.dynatrace.com/support/help/get-started/what-is-dynatrace).
Also, please feel free to join our [Slack community](https://dub.sh/tracetest-community), give [Tracetest a star on GitHub](https://github.com/kubeshop/tracetest), or schedule a [time to chat 1:1](https://calendar.app.google/8qHAomjQZDKKDARd8).
Related Content
.jpg)
.jpg)
.jpg)
Stay in the Loop

Join the Tracetest Community in one of these channels:


— a first of its kind open source accelerator focused on the cloud native ecosystem


